Climate Change
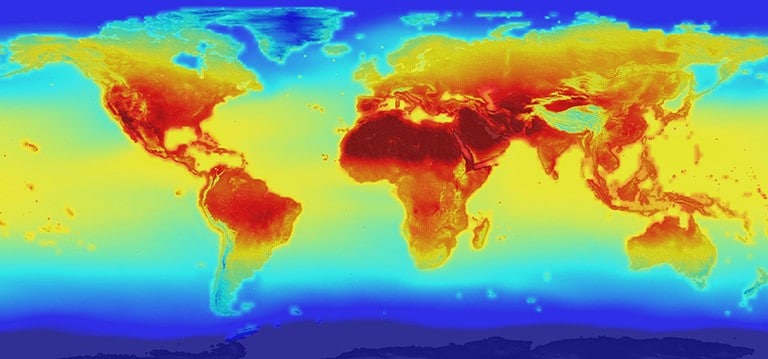
Figure 1 – Global temperature map from modeled climate change scenarios. Source NASA
Climate change is the change in weather conditions over a period of 30 years of more. Our planet’s climate has changed throughout history, with ice ages and periods of warming, though never as quickly as it is changing now. The rate of climate change has significantly increased which means that on average the climate is warming more quickly than ever before. The increase in temperature brings with it an increase in extreme weather conditions, including wildfires, heat waves and storms. Additionally, the increase in average global heat is causing sea levels to rise exceedingly fast as seawater volume expands and ice caps melt.
Human activity has greatly accelerated the rate of warming across the planet, with scientific evidence clearly demonstrating the link between global temperature increase and human generated greenhouse gas emissions. We have already experienced a rise in average global temperature of around 1°C since the pre-industrial period (1) with Australia’s temperature increasing more than 1°C since 1910 (2). Greenhouse gas emissions come from many sources, but the biggest sources in Australia are burning fossil fuels, farming animals and clearing land (3).
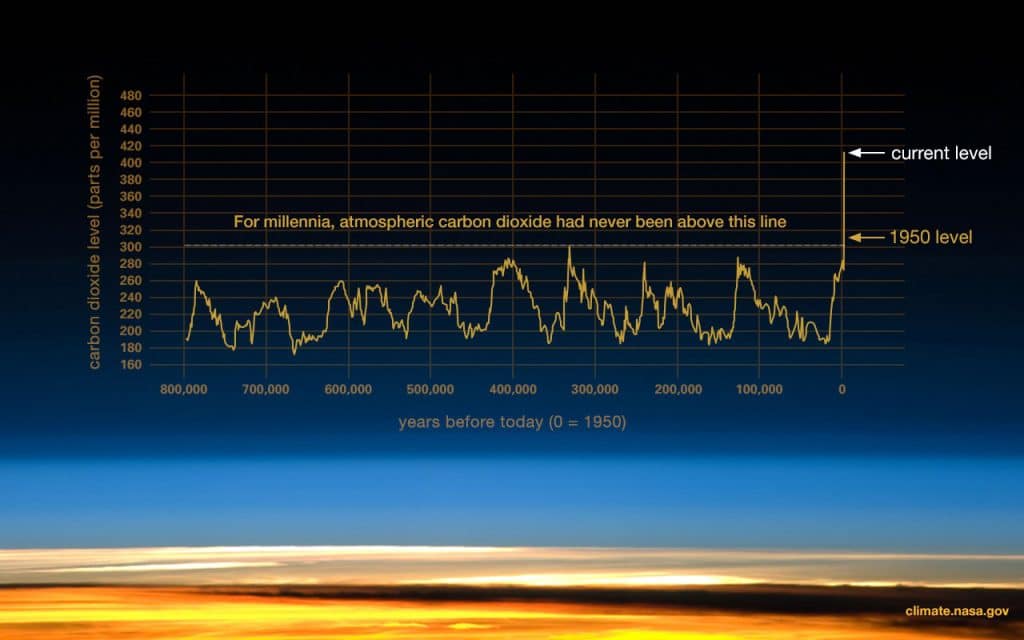
Figure 2 Evidence that the atmospheric CO2 increased since the industrial revolution. Source NASA.
Projected local climate change impacts for the Sydney region (4) include:
- Maximum temperatures increases of up to 1.0°C by 2030 and up to 2.5°C by 2070. Minimum temperatures increases of up to 0.8°C by 2030 and up to 2.5°C by 2070.
- Increased number of hot days (>35°C). On average, the region will experience an additional four hot days by 2030 and eleven more hot days by 2070.
- Increase in extreme weather events such as heat waves, extended droughts, severe fire weather, hail storms and heavy rain or wind activity.
Climate change is a personal issue as much as a community issue, with everyone’s individual lifestyles and choices together responsible for humanity’s generation of greenhouse gas emissions. The relationship between supply and demand gives us the ability to shape and transform the future, by supporting practices that are sustainable and opposing those that are destructive.
An interactive indicator of how sustainable your own lifestyle is can be found by doing an ecological footprint study. Go to this website for an easy to complete 5 minute ecological footprint calculation.
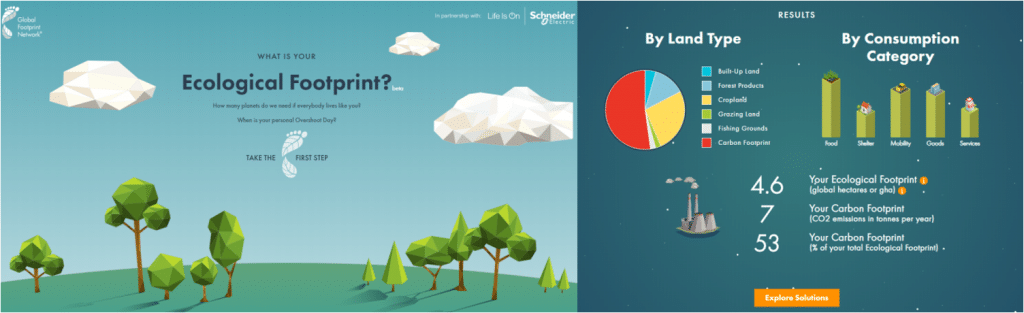
Figure 3 Ecological Footprint calculator by the Global Footprint Network.
Below are some of the best things you can do to reduce your climate change footprint, from most to least impactful (5):
- Choose plant based food over animal products (i.e. eat less meat, fewer dairy products and fewer eggs) and locally grown produce where possible
- Shop based on ‘needs’ not ‘wants’ to reduce number of new items bought (particularly clothing). Share or choose pre-loved or re-usable options where possible
- Install renewable energy systems on your home, minimise energy use and travel actively or on public transport where possible
- Purchase an electric or hybrid vehicle if possible for necessary driving trips
- Travel locally to avoid long flights or minimise overseas travel (e.g. taking fewer holidays that last longer)
- Minimise your waste footprint by following the ‘reduce, re-use, recycle’ principle
To learn more about climate change visit:
- The Commonwealth Department of Environment website is a good site to keep in touch with developments on policy, research, and government rebates relating to energy efficiency.
- The NSW Office of Environment, Energy and Science website provides information on how climate change will affect NSW, details on what actions are being taken by the State Government to tackle climate change.
- The CSIRO provides comprehensive science to help Australia understand, respond to and plan for a changing climate.
- The IPCC gives an international context to Climate Change, with rigorous science and guidance to support world governments in minimising emissions and responding to climate change.
References:
- IPCC, 2018: Summary for Policymakers. In: Global Warming of 1.5°C. An IPCC Special Report on the impacts of global warming of 1.5°C above pre-industrial levels and related global greenhouse gas emission pathways, in the context of strengthening the global response to the threat of climate change, sustainable development, and efforts to eradicate poverty [Masson-Delmotte, V., P. Zhai, H.-O. Pörtner, D. Roberts, J. Skea, P.R. Shukla, A. Pirani, W. Moufouma-Okia, C. Péan, R. Pidcock, S. Connors, J.B.R. Matthews, Y. Chen, X. Zhou, M.I. Gomis, E. Lonnoy, T. Maycock, M. Tignor, and T. Waterfield (eds.)]. In Press. https://www.ipcc.ch/site/assets/uploads/sites/2/2019/05/SR15_SPM_version_report_LR.pdf
- CSIRO, State of the Climate 2018, Australia’s Changing Climate, https://www.csiro.au/en/Research/OandA/Areas/Assessing-our-climate/State-of-the-Climate-2018/Australias-changing-climate
- Quarterly Update of Australia’s National Greenhouse Gas Inventory: March 2019, Commonwealth of Australia 2019. https://www.environment.gov.au/system/files/resources/6686d48f-3f9c-448d-a1b7-7e410fe4f376/files/nggi-quarterly-update-mar-2019.pdf
- Office of Environment & Heritage, 2014: Metropolitan Sydney Climate Change Snapshot
- C40 Cities, Arup & University of Leeds, The Future of Urban Consumption in a 1.5°C World, June 2019. https://www.c40.org/consumption